Cross-Sport Velocity Tracking: How Pitch Speeds, Serve Aces, Sprint Bursts, and Shot Velocities Correlate with Performance Charts in MLB, Tennis, Soccer, and NBA Contests
Written by Xander Schmid · May 29, 2026
Cross-Sport Velocity Tracking: How Pitch Speeds, Serve Aces, Sprint Bursts, and Shot Velocities Correlate with Performance Charts in MLB, Tennis, Soccer, and NBA Contests
Velocity tracking has become a standard tool across major sports leagues as teams and analysts measure how fast athletes move objects or themselves during competition. Data from MLB, tennis tours, soccer federations, and the NBA reveal patterns that link speed metrics to outcomes on leaderboards, and these connections continue to shape training and scouting decisions through May 2026.
MLB Pitch Velocity and Strikeout Trends
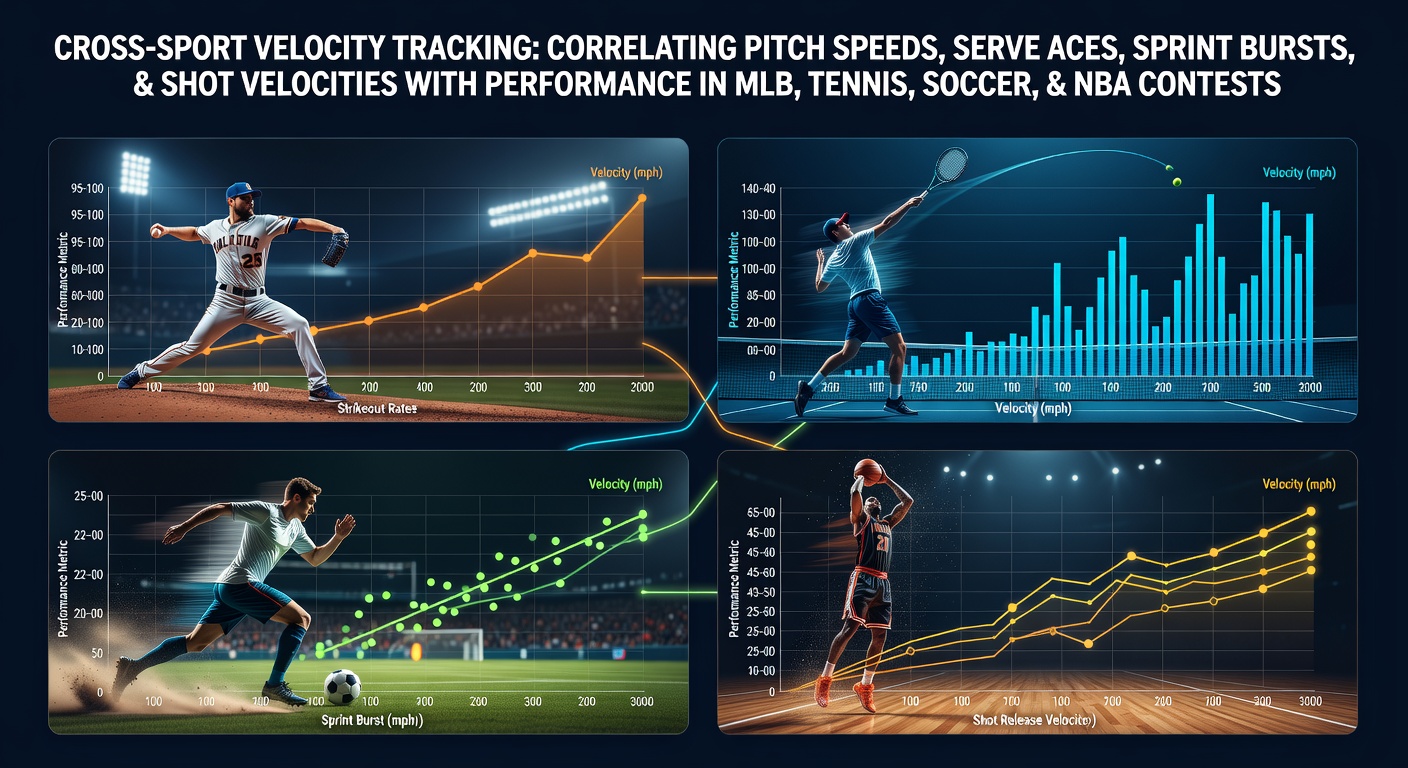
MLB pitchers who reach higher release speeds tend to record more strikeouts per nine innings according to Statcast tracking systems. A fastball thrown at 95 miles per hour or above often produces swing-and-miss rates above league averages while pitches in the low 90s show lower whiff percentages on similar locations. Teams compile these figures season after season and find that starters maintaining 94-plus mph averages post lower earned run averages in most cases. Relievers who touch 98 mph or more appear in high-leverage situations more frequently because their velocity spikes create late-count advantages. Observers note that command remains essential yet raw speed still separates top performers on leaderboards year after year.
Tennis Serve Speed and Ace Production
Professional tennis players generate serve speeds that directly influence ace totals and hold percentages on both ATP and WTA tours. Serves exceeding 130 miles per hour on grass courts produce ace rates above 15 percent in many matches while slower deliveries on clay surfaces require greater spin and placement to achieve similar results. Data from Hawk-Eye systems show that players who average 120 mph or higher on first serves win a higher share of service points across hard-court events. Second-serve velocities in the 100 to 110 mph range correlate with fewer double faults when players maintain consistent spin rates. Performance charts from recent majors indicate that those who combine high speed with accurate placement reach later rounds more often than peers who rely solely on placement.
Soccer Sprint Bursts and Goal Involvement
Soccer tracking devices record sprint distances and top speeds during matches and these numbers align with player contributions on team score sheets. Wingers and forwards who hit 22 miles per hour or faster in short bursts create more scoring chances according to league-wide optical data. Midfielders covering high-speed runs above 19 miles per hour per 90 minutes frequently record more key passes and progressive carries. Defensive players who reach peak velocities during recovery runs limit opponent transitions at higher rates. European and South American domestic leagues publish these metrics and the patterns remain consistent across different competition levels.
NBA Shot Velocity and Shooting Efficiency
NBA teams use camera and sensor systems to measure release speeds on jump shots and these figures connect to field-goal percentages at various distances. Guards releasing three-point attempts at higher velocities often maintain better accuracy when contested because quicker releases reduce defensive close-out windows. Data sets from recent seasons show that players with release times under 0.8 seconds and ball speeds above certain thresholds post higher true-shooting percentages. Big men who generate higher velocity on hook shots inside the paint convert at elevated rates compared with slower releases. Performance charts compiled by basketball analytics groups list these speed metrics alongside traditional box-score categories.
Cross-Sport Patterns and Shared Data Insights
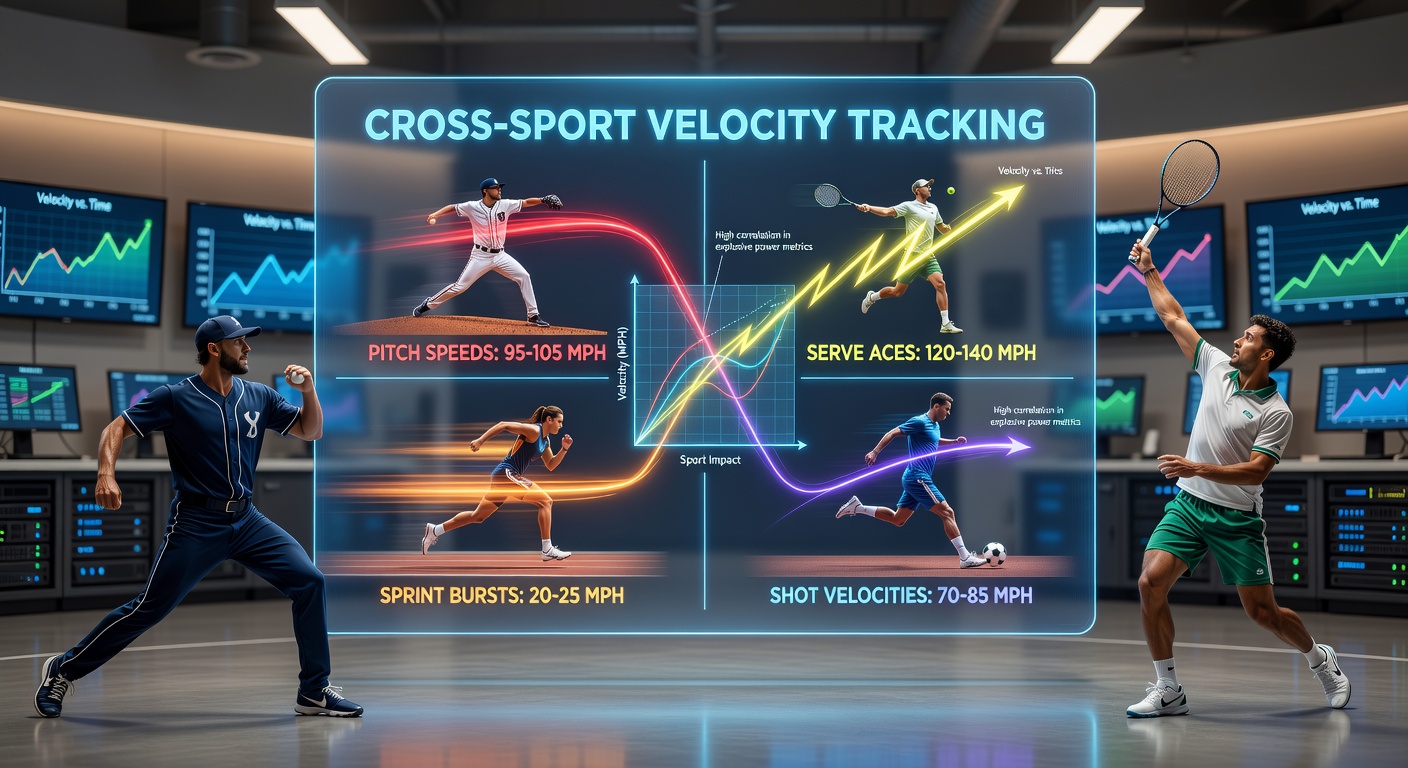
Analysts compare velocity figures across disciplines and identify common threads even though equipment and rules differ. Higher object or body speeds generally associate with improved offensive production whether the metric is strikeouts, aces, created chances, or made baskets. Yet each sport adds layers such as pitch movement in baseball, spin in tennis, decision-making under fatigue in soccer, and defensive pressure in basketball. Research from university sports science departments indicates that athletes who train velocity-specific drills show measurable gains on performance charts within one or two seasons. League databases updated through May 2026 continue to feed these comparisons and front offices adjust draft and trade strategies accordingly.
Training Applications and Technology Integration
Coaches incorporate radar guns, wearable accelerometers, and high-speed cameras to monitor velocity development during practice sessions. Pitchers in MLB organizations follow structured bullpen programs that track mph gains over weeks while tennis players use serve-speed apps to fine-tune mechanics between tournaments. Soccer clubs run repeated sprint drills with GPS units that log peak velocities and recovery intervals. NBA strength staff measure release speeds on shooting machines and adjust footwork cues to maintain or increase those numbers under fatigue. These methods produce incremental improvements that appear on official performance charts when the regular season begins.
Conclusion
Velocity tracking supplies objective numbers that teams and tours use to evaluate talent and refine preparation across MLB, tennis, soccer, and the NBA. The correlations between speed metrics and performance outcomes remain visible on updated leaderboards while technology continues to refine measurement precision. Athletes and staff who integrate these tools gain clearer pictures of where gains are possible and how those gains translate into competitive results.