Data Patterns on International Travel Distances and Athlete Recovery Across Major Sports
Written by Rosa Klein · May 31, 2026
Data Patterns on International Travel Distances and Athlete Recovery Across Major Sports
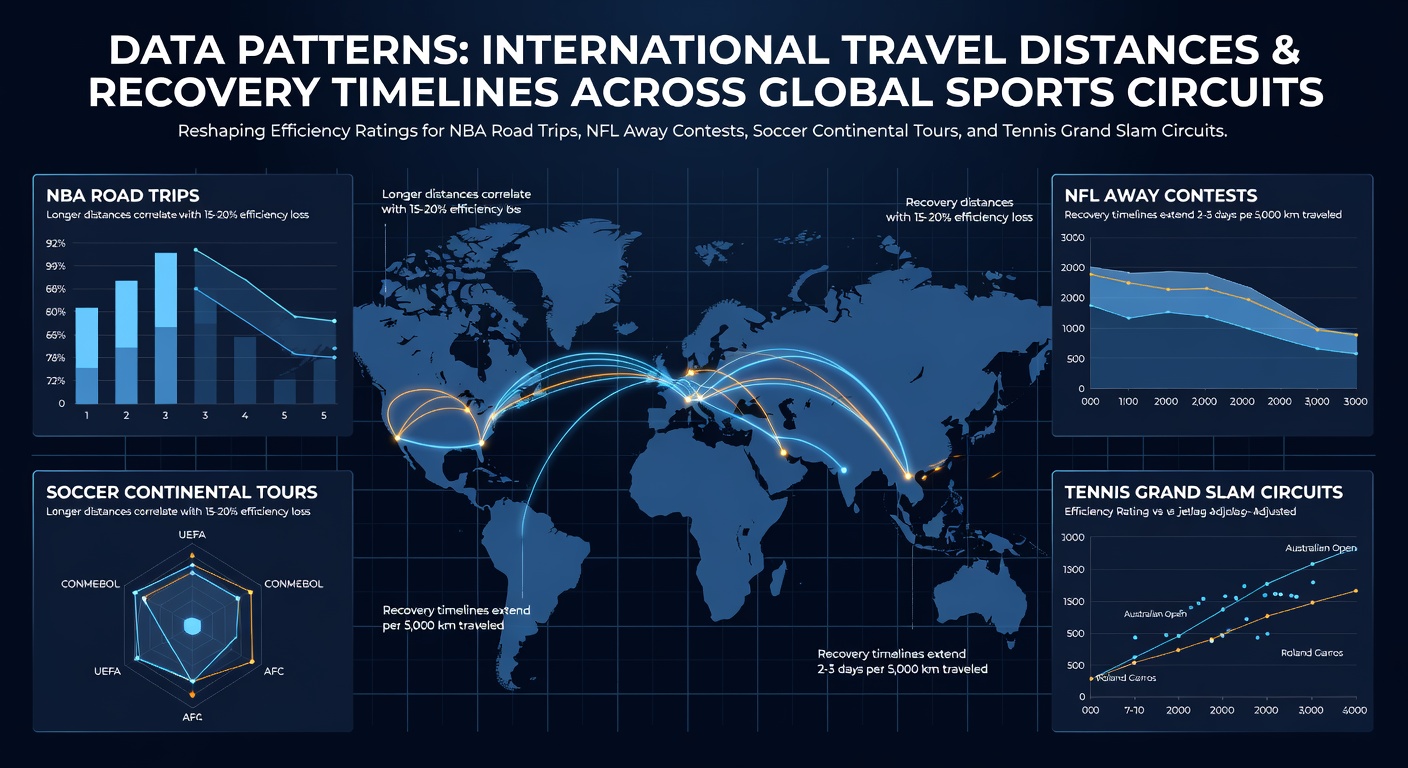
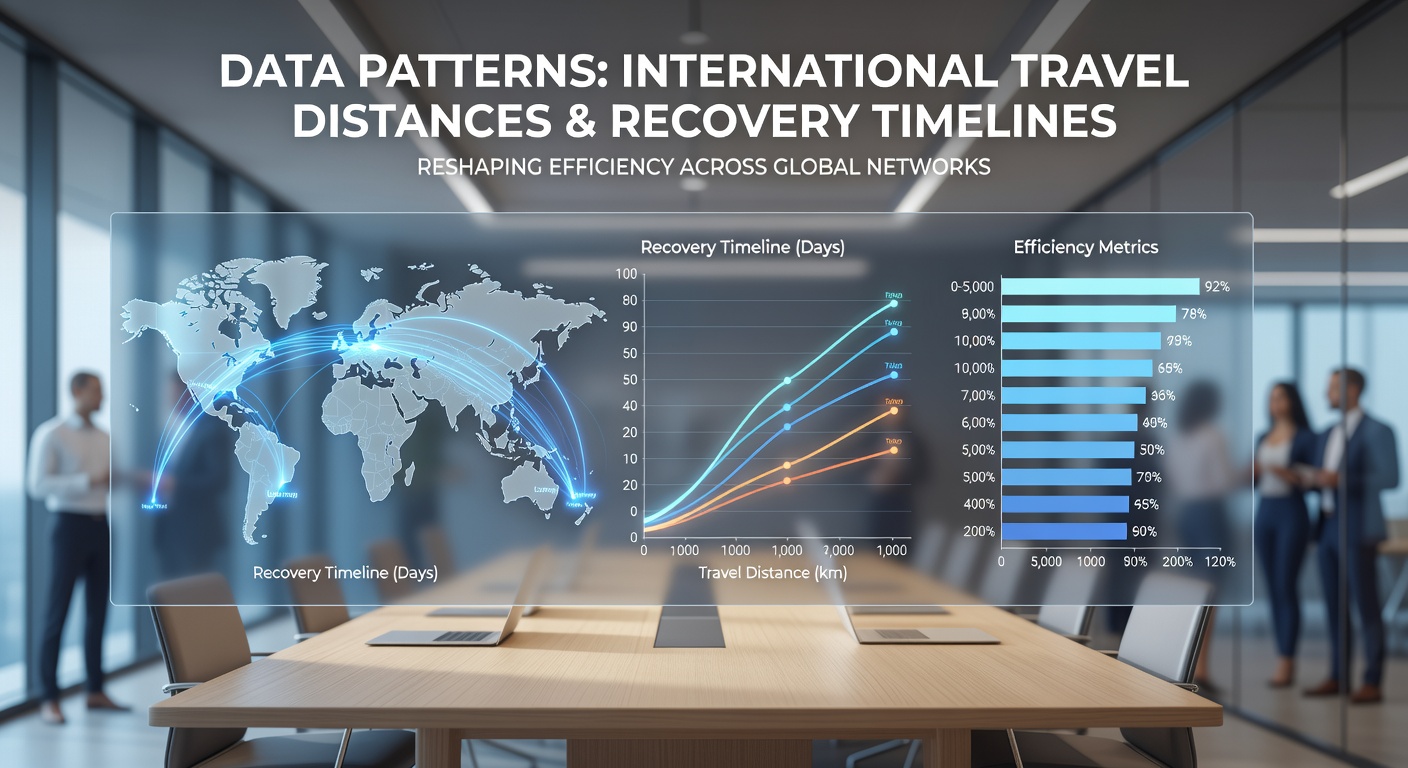
International travel distances create measurable shifts in recovery timelines and efficiency ratings for athletes competing across NBA road trips, NFL away games, soccer continental tours, and tennis grand slam events, according to compiled performance datasets from league tracking systems. Researchers who examined flight logs alongside biometric records found that trips exceeding eight hours often extend required rest periods by 24 to 48 hours before players return to baseline output levels.
NBA Road Trip Analysis
NBA teams log extensive cross-country and occasional international flights during the regular season, and data from the league's player tracking program shows that back-to-back games following transcontinental travel correlate with reduced shooting percentages and lower defensive efficiency ratings. Observers note patterns where West Coast squads traveling east experience sharper drops in fourth-quarter scoring because circadian disruptions linger longer when time zones shift forward by three hours or more. Studies conducted through university sports science departments indicate that recovery windows stretch further when teams cross multiple time zones rather than stay within one, while shorter domestic hops allow quicker return to standard workload capacities.
NFL Away Contest Metrics
NFL squads face fewer games per season yet cover substantial distances for away contests, particularly during international series in London and Germany, and figures from league injury reports reveal elevated soft-tissue strain rates among players who arrive less than five days before kickoff. Analysts tracking GPS and heart-rate variability data observe that transatlantic flights produce slower reaction times in the first half, which then influence offensive line efficiency and defensive coverage ratings. Teams that schedule extra acclimation days demonstrate steadier snap-to-snap performance numbers, whereas rushed arrivals show persistent gaps in third-down conversion metrics through the opening quarters.
Soccer Continental Tour Patterns
European and South American clubs competing in continental tournaments such as the Champions League or Copa Libertadores encounter repeated long-haul segments, and aggregated match statistics collected by confederation data platforms indicate that squads traveling over 10,000 kilometers in a single week post lower possession retention percentages in the subsequent domestic fixture. European College of Sport Science reports highlight how recovery timelines extend when players cross both hemispheres because jet lag compounds with match congestion, while clubs that insert midweek rest protocols maintain steadier passing accuracy and pressing intensity ratings. Data collected during the 2025-2026 campaign shows these effects remain visible even in May 2026 fixtures when summer schedules begin overlapping with pre-tournament travel demands.
Tennis Grand Slam Circuit Findings
Tennis players navigate the most fragmented travel calendar because grand slams rotate across continents within weeks, and performance databases maintained by the ATP and WTA reveal that athletes arriving from opposite hemispheres post lower first-serve percentages and extended rally endurance scores during early rounds. Researchers who paired flight duration logs with match-tracking sensors discovered that recovery efficiency improves when players insert at least 72 hours between arrival and first match, whereas compressed schedules produce measurable declines in movement speed and error rates that persist into later tournament stages. Observers tracking multiple seasons note that baseline grinders who manage time-zone shifts through structured light exposure protocols sustain higher win rates in five-set matches compared with those who arrive closer to the start of play.
Cross-Sport Efficiency Comparisons
Comparative datasets drawn from all four sports demonstrate that recovery timelines scale with both distance and frequency of travel, yet efficiency rating drops vary by sport-specific demands. NBA and soccer athletes show pronounced dips in high-intensity actions after long flights, while NFL linemen register slower acceleration metrics and tennis competitors exhibit reduced serve velocity. Those who've studied these patterns across multiple seasons point to consistent thresholds: flights beyond six hours reliably extend full physiological recovery beyond 36 hours, and teams or individuals who build buffer days into itineraries record steadier output across subsequent contests. Recent 2026 tracking updates continue to confirm these relationships hold during overlapping international windows.
Conclusion
League-wide datasets and academic tracking studies together establish that international travel distances directly influence both the length of recovery periods and the efficiency ratings athletes post in NBA, NFL, soccer, and tennis competitions. Patterns remain consistent across seasons because time-zone shifts and flight durations produce predictable physiological adjustments that teams and players address through scheduling and preparation protocols.