Sensor-Driven Strategies: How Tracking Devices Refine Passing Networks in NFL Games, Spacing Systems in NBA Lineups, and Possession Flows in Soccer Matches
Written by Xander Schmid · May 24, 2026
Sensor-Driven Strategies: How Tracking Devices Refine Passing Networks in NFL Games, Spacing Systems in NBA Lineups, and Possession Flows in Soccer Matches
Tracking devices equipped with RFID tags, GPS units, and inertial sensors have transformed how professional leagues collect positional data across every snap, possession, and shift. These systems record player coordinates multiple times per second, allowing analysts to map passing networks in the NFL, measure spacing efficiency in NBA lineups, and trace possession flows in soccer matches. As of May 2026, teams continue to integrate updated firmware and machine-learning models that process the streams in near real time, turning raw coordinates into actionable network graphs and heat maps.
Core Components of Modern Tracking Systems
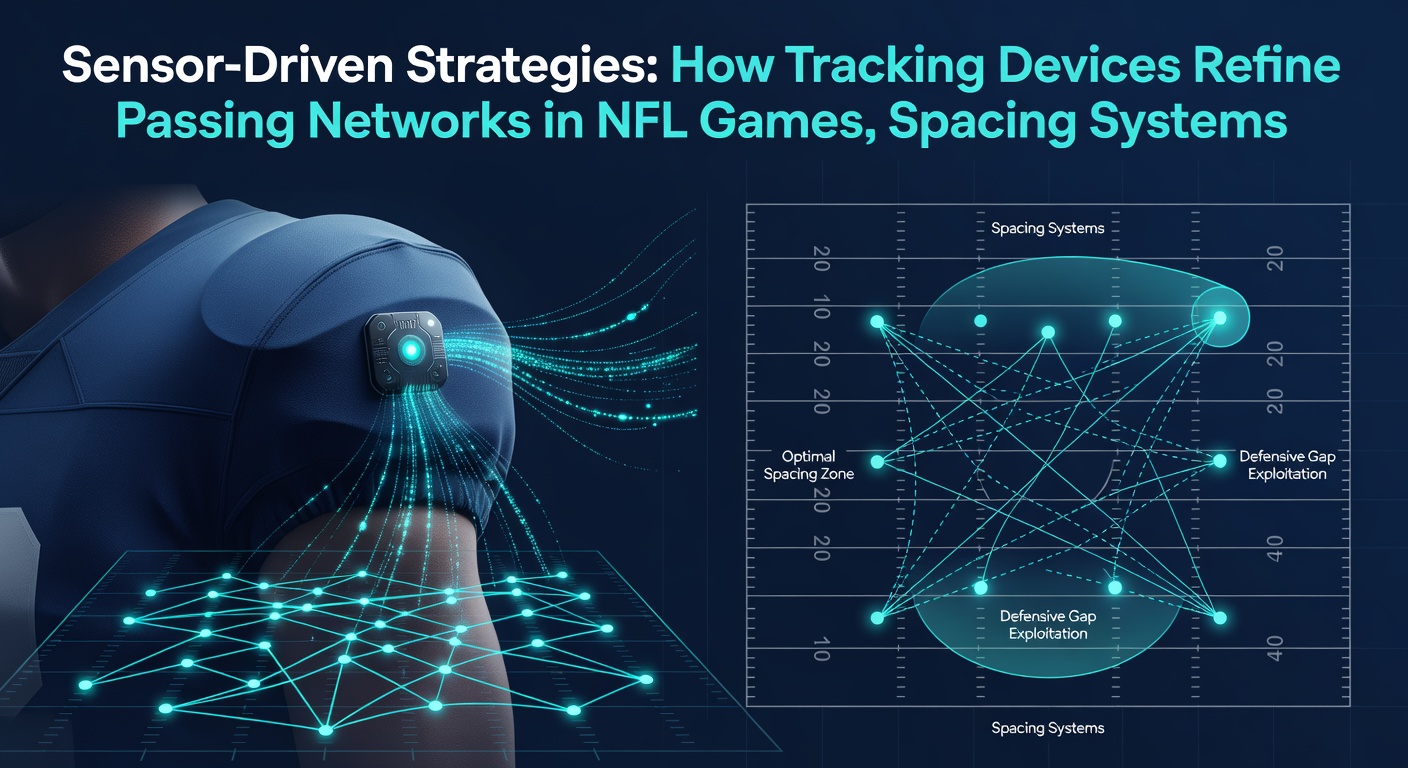
Each league deploys its own hardware mix yet shares common data pipelines. NFL teams embed RFID chips in shoulder pads and the ball itself, feeding fixed antennas around stadiums that capture location at 10 hertz. NBA arenas rely on optical tracking supplemented by wearable accelerometers, while soccer clubs outfit players with GPS vests that log speed, acceleration, and torso orientation at 100 hertz. Researchers at institutions such as the Sports Science Institute have documented how these sampling rates enable reconstruction of every route stem, defensive closeout, and pressing trigger with sub-meter accuracy.
Mapping NFL Passing Networks
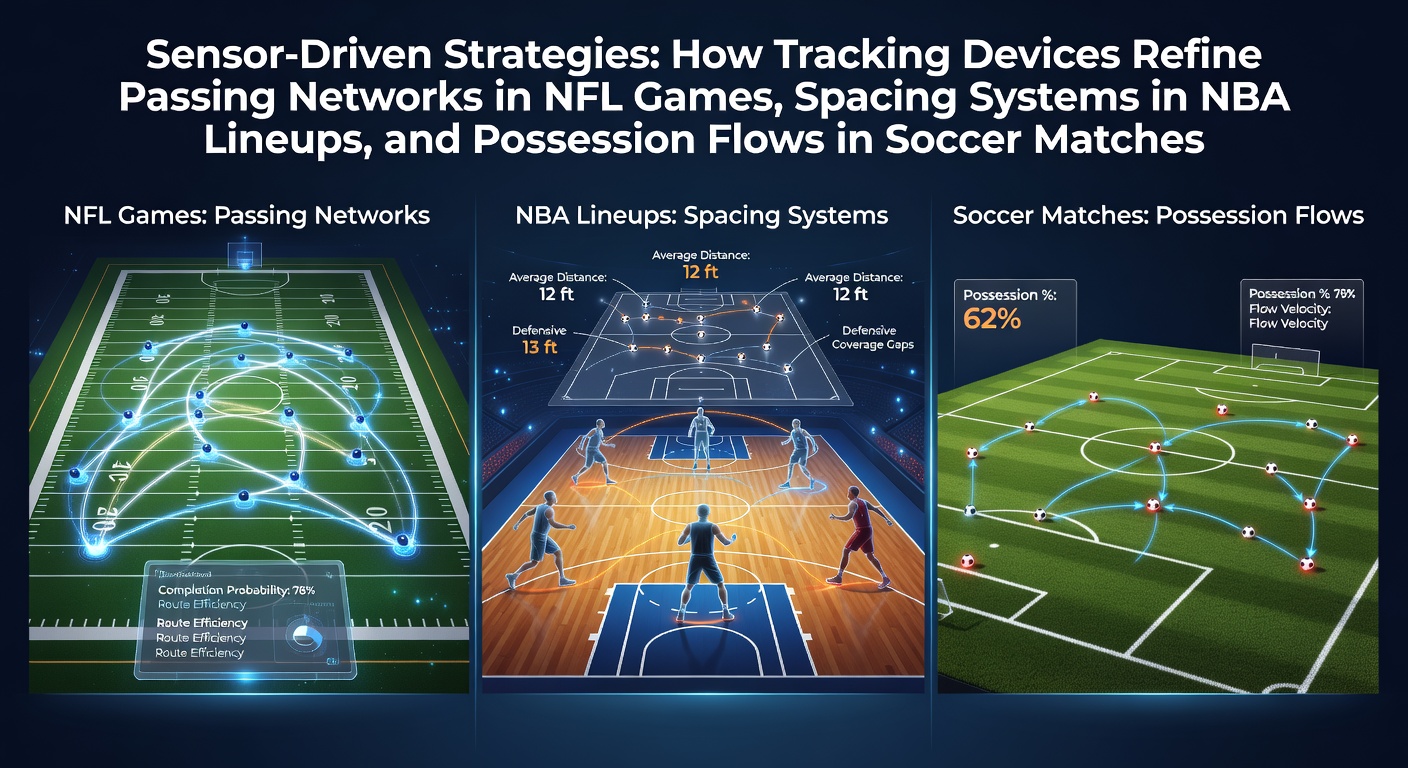
In the NFL, sensor output feeds algorithms that convert raw player trajectories into weighted directed graphs. Each completed pass becomes an edge whose thickness reflects completion probability given the defensive spacing recorded at release. Quarterbacks and coaches review these graphs to identify underutilized seams; for example, data from the 2025 season showed that certain slot receivers created higher expected completion values when aligned three yards wider than their historical average. Defensive coordinators counter by adjusting zone drops according to the same sensor-derived likelihood surfaces, shifting linebackers into passing lanes that previously appeared open on film alone.
Adjusting NBA Spacing Systems
NBA spacing analysis begins with continuous x-y coordinates of all ten players on the floor. Tracking data reveals how a shooter’s gravity stretches a defense by measuring the increase in distance between help defenders and the basket whenever that shooter relocates beyond the arc. Teams adjust lineup combinations when the data indicate that two non-shooters on the floor simultaneously compress spacing below a critical threshold, reducing driving lanes for the primary creator. During the 2025-2026 regular season, several clubs modified their corner spacing rules after reviewing sensor logs that quantified how defensive rotations lagged by an average of 0.4 seconds when the ball reversed through the top of the key.
Tracing Soccer Possession Flows
Soccer analysts convert GPS and optical data into possession chains that record every pass, carry, and duel outcome along with the spatial context of teammates and opponents. These chains are aggregated into flow diagrams that highlight progressive sequences leading to shots. Midfield units have altered their build-up shapes after sensor reports showed that certain wide-center combinations increased the probability of progressing past the first pressing line by 12 percent. Goalkeepers and center-backs review the same models to time their distributions, targeting zones where the opponent’s high press leaves measurable gaps in coverage.
Cross-Sport Analytical Parallels
Although the sports differ in rules and field dimensions, the underlying sensor pipelines share processing steps. Each league normalizes coordinates to a common field template, filters noise with Kalman smoothers, and applies graph neural networks to detect repeating patterns. Observers note that NFL passing networks, NBA spacing vectors, and soccer possession sequences all reduce to node-edge structures that quantify connectivity and centrality. Staffs therefore borrow visualization tools across leagues, adapting the same dashboard layouts to display centrality scores for wide receivers, stretch bigs, and deep-lying midfielders alike.
Implementation Timeline and League Standards
Standardization efforts accelerated after 2023 when the NFL and NBA formalized data-sharing agreements with their respective tracking providers. Soccer’s major competitions followed with unified metadata schemas in 2024. By May 2026, every regular-season game across the three leagues feeds the same cloud infrastructure, allowing comparative studies that examine how different tactical systems respond to identical spatial constraints. Academic partners in Australia and Canada have published open datasets that contain anonymized match files, enabling independent verification of network metrics without violating league intellectual-property rules.
Conclusion
Sensor-derived metrics now underpin practice design, in-game adjustments, and offseason roster construction across the NFL, NBA, and top soccer leagues. The continuous stream of positional data supplies the factual foundation for refining passing networks, spacing systems, and possession flows, while standardized pipelines ensure that findings remain reproducible as hardware and algorithms evolve.