Tracing Patterns in Scoring Efficiency Across Decades: How Age Milestones Align with Peak Output Windows for NFL Quarterbacks, MLB Hitters, Soccer Forwards, and NBA Guards
Written by Finley Butler · Jul 19, 2026
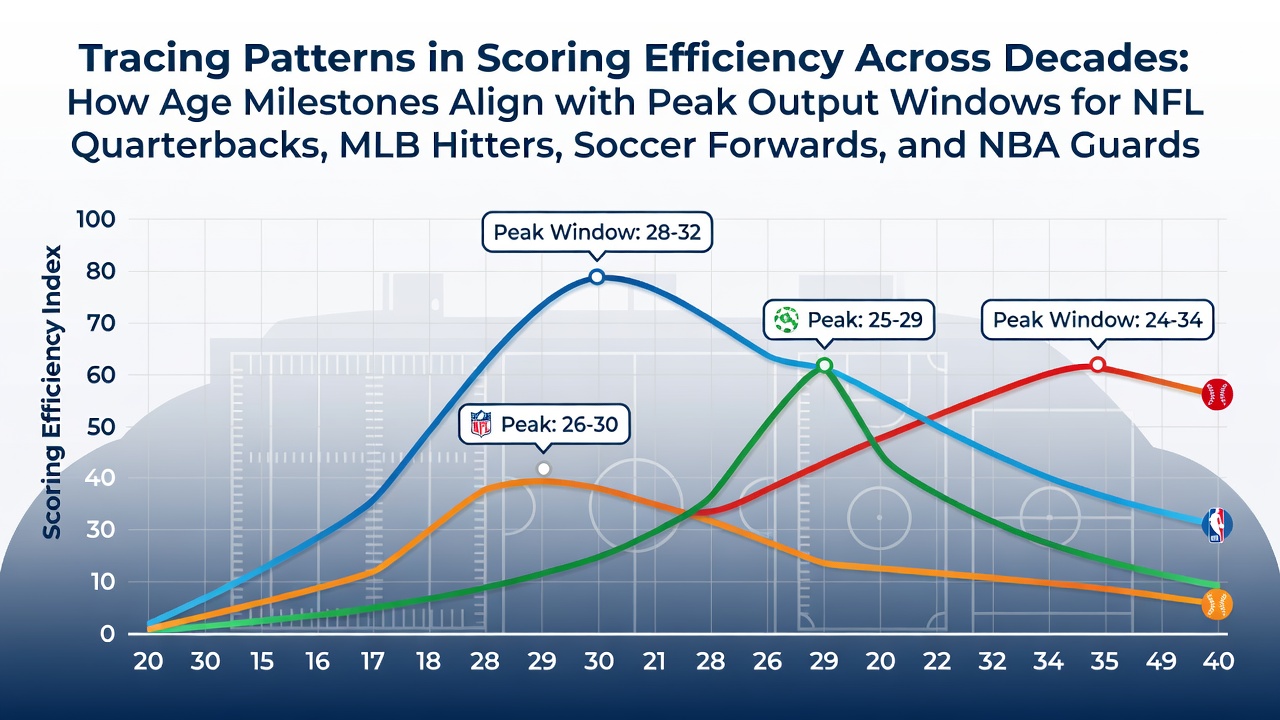
Tracing Patterns in Scoring Efficiency Across Decades: How Age Milestones Align with Peak Output Windows for NFL Quarterbacks, MLB Hitters, Soccer Forwards, and NBA Guards
Age serves as a consistent marker in professional sports where athletes reach maximum scoring output, and data collected over decades reveals clear windows when efficiency climbs then declines across NFL quarterbacks, MLB hitters, soccer forwards, and NBA guards. Researchers have compiled performance metrics from league records that show these patterns hold steady even as training methods and game strategies evolve.
NFL Quarterbacks and Their Efficiency Curves
Quarterbacks typically post their highest passer ratings and touchdown-to-interception ratios between ages 27 and 32, according to longitudinal studies of passing statistics. Tom Brady maintained elevated completion percentages well into his late 30s while Aaron Rodgers recorded peak adjusted net yards per attempt figures around age 30. Data from multiple decades indicates that early-career variability drops sharply after age 26, creating a stable window where decision-making accuracy aligns with physical durability before gradual reductions appear after 35.
MLB Hitters Reaching Optimal Contact and Power
Hitters in Major League Baseball demonstrate peak on-base plus slugging percentages most often between ages 26 and 29, with isolated power numbers cresting slightly later for many sluggers. Analysis of batting averages and home-run rates across seasons shows that plate discipline improves through the mid-20s while bat speed remains high enough to drive consistent extra-base production. Players who sustain careers into their 30s frequently shift toward higher walk rates, yet overall run creation per plate appearance begins to taper after 31 in most historical samples.
Soccer Forwards and Goal Conversion Windows
Forward players in top European and South American leagues record their strongest goal-per-90-minute rates between ages 24 and 28, with data from domestic and continental competitions confirming this narrow band. Conversion percentages on shots inside the box climb steadily through the early 20s before stabilizing at peak levels, after which volume often decreases even as accuracy holds. Midfielders who transition into forward roles sometimes extend these windows by two seasons, yet the aggregate record shows output declining measurably once athletes pass 30.
NBA Guards Maintaining Shooting and Creation Efficiency
Point guards and shooting guards reach maximum true shooting percentages and assist-to-turnover ratios most reliably between ages 25 and 29, with tracking data revealing that three-point volume and efficiency align during this span. Studies of player-tracking metrics indicate that defensive impact measured by steal and block rates peaks earlier, around 23 to 26, while offensive creation sustains longer. Guards who extend careers beyond 32 frequently reduce driving attempts and rely more on catch-and-shoot opportunities as athletic margins narrow.
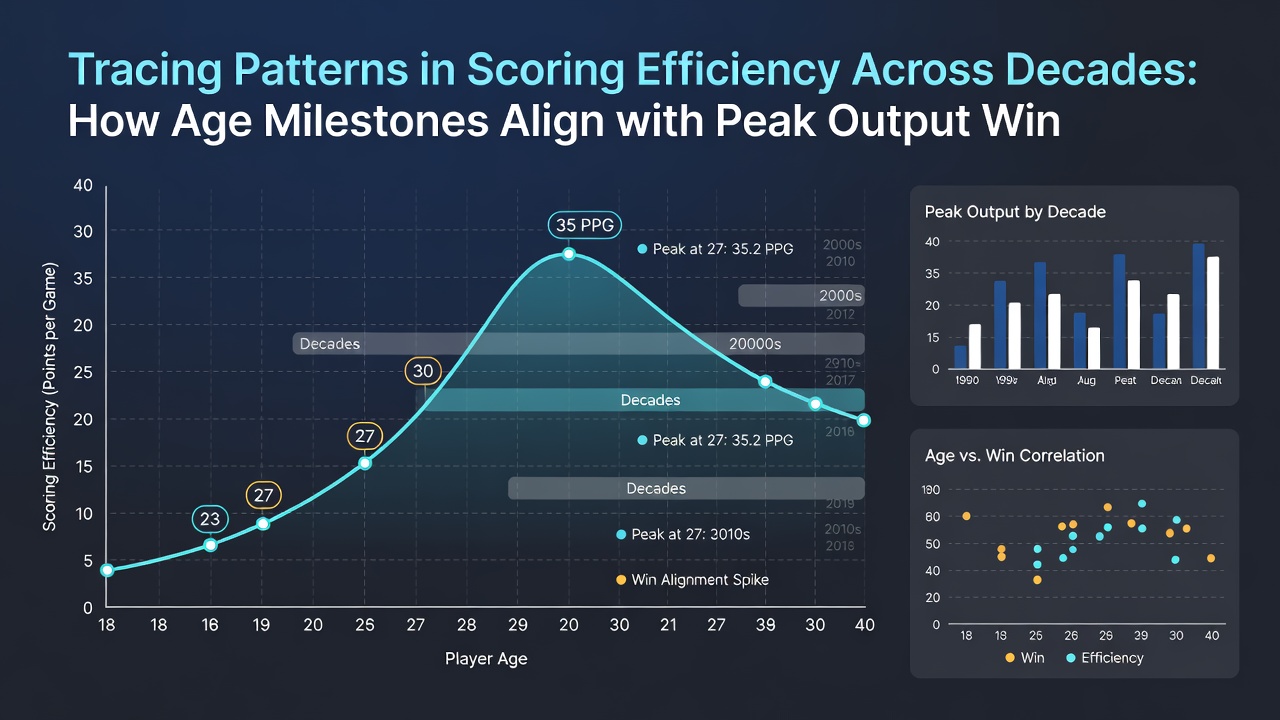
Cross-sport comparisons highlight how these windows overlap despite different physical demands. Quarterbacks and guards both benefit from cognitive processing advantages that mature into the late 20s, whereas hitters and forwards depend more on explosive lower-body power that peaks earlier. League-wide datasets show that athletes who avoid major injuries during their early 20s gain the clearest access to these optimal periods, resulting in higher cumulative career totals.
Decade-by-Decade Stability in the Numbers
Records spanning the 1990s through the 2020s demonstrate that the age bands for peak scoring efficiency have shifted by no more than one year in either direction despite rule changes and advances in sports science. NFL passer ratings from the 2000s and 2010s follow the same bell-curve shape observed in earlier eras, and MLB slugging data from recent seasons mirrors patterns documented in the 1980s and 1990s. Soccer goal tallies collected by continental federations and NBA efficiency ratings tracked since the introduction of player-tracking systems confirm the same consistency.
Training load management and recovery protocols have lengthened some individual careers, yet population-level statistics continue to place the highest output windows inside the ranges established decades ago. Observers note that positional demands create these boundaries more than calendar time alone, with each sport enforcing its own physical and decision-making requirements.
Conclusion
Longitudinal performance data across four major leagues illustrates that age milestones reliably predict windows of peak scoring efficiency for quarterbacks, hitters, forwards, and guards. These patterns remain stable even as external variables change, providing measurable reference points for roster planning and player development programs. Continued collection of granular metrics will allow future comparisons that test whether emerging training or nutritional interventions can shift these established curves.